


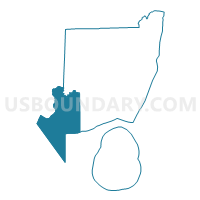
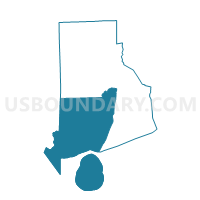
Westerly town, Washington County, Rhode Island
About
Outline

Summary
| Unique Area Identifier | 151315 |
| Name | Westerly town |
| County | Washington County |
| State | Rhode Island |
| Area (square miles) | 74.57 |
| Land Area (square miles) | 29.52 |
| Water Area (square miles) | 45.05 |
| % of Land Area | 39.59 |
| % of Water Area | 60.41 |
| Latitude of the Internal Point | 41.32833650 |
| Longtitude of the Internal Point | -71.78468070 |
| Total Population | 22,787 |
| Total Housing Units | 12,320 |
| Total Households | 9,666 |
| Median Age | 44.3 |
Maps
Graphs
Select a template below for downloading or customizing gragh for Westerly town, Washington County, Rhode Island


Neighbors
Neighoring County Subdivision (by Name) Neighboring County Subdivision on the Map
- Charlestown town, Washington County, RI
- East Hampton town, Suffolk County, NY
- Hopkinton town, Washington County, RI
- North Stonington town, New London County, CT
- Southold town, Suffolk County, NY
- Stonington town, New London County, CT
Top 10 Neighboring Place (by Population) Neighboring Place on the Map
- Westerly CDP, RI (17,936)
- Pawcatuck CDP, CT (5,624)
- Ashaway CDP, RI (1,485)
- Bradford CDP, RI (1,406)
- Stonington borough, CT (929)
- Weekapaug CDP, RI (425)
- Misquamicut CDP, RI (390)
- Watch Hill CDP, RI (154)
Top 10 Neighboring Unified School District (by Population) Neighboring Unified School District on the Map
- Chariho Regional School District, RI (23,723)
- Westerly School District, RI (22,787)
- Stonington School District, CT (18,545)
- School District Not Defined, NY (13,644)
- North Stonington School District, CT (5,297)
- Fishers Island Union Free School District, NY (236)
Top 10 Neighboring State Legislative District Lower Chamber (by Population) Neighboring State Legislative District Lower Chamber on the Map
- Assembly District 1, NY (149,382)
- Assembly District 2, NY (142,833)
- State House District 43, CT (23,842)
- State House District 38, RI (14,987)
- State House District 39, RI (14,717)
- State House District 37, RI (14,444)
- State House District 36, RI (13,098)
Top 10 Neighboring State Legislative District Upper Chamber (by Population) Neighboring State Legislative District Upper Chamber on the Map
- State Senate District 1, NY (341,254)
- State Senate District 18, CT (102,472)
- State Senate District 34, RI (30,357)
- State Senate District 38, RI (28,713)
Top 10 Neighboring 111th Congressional District (by Population) Neighboring 111th Congressional District on the Map
- Congressional District 2, CT (729,771)
- Congressional District 1, NY (705,559)
- Congressional District 2, RI (533,546)
Top 10 Neighboring Census Tract (by Population) Neighboring Census Tract on the Map
- Census Tract 507, Washington County, RI (8,188)
- Census Tract 508.01, Washington County, RI (5,907)
- Census Tract 509.01, Washington County, RI (5,893)
- Census Tract 509.02, Washington County, RI (5,495)
- Census Tract 7071, New London County, CT (5,297)
- Census Tract 511.01, Washington County, RI (4,665)
- Census Tract 7051.02, New London County, CT (4,343)
- Census Tract 7051.01, New London County, CT (4,294)
- Census Tract 1702.02, Suffolk County, NY (4,029)
- Census Tract 508.02, Washington County, RI (3,914)
Top 10 Neighboring 5-Digit ZIP Code Tabulation Area (by Population) Neighboring 5-Digit ZIP Code Tabulation Area on the Map
- 02891, RI (21,198)
- 06379, CT (9,038)
- 02813, RI (7,831)
- 06378, CT (5,399)
- 06359, CT (5,313)
- 02804, RI (2,607)
- 02808, RI (2,401)
Data
Demographic, Population, Households, and Housing Units
** Data sources from census 2010 **
Show Data on Map
Download Full List as CSV
Download Quick Sheet as CSV
| Subject | This Area | Washington County | Rhode Island | National |
|---|---|---|---|---|
| POPULATION | ||||
| Total Population Map | 22,787 | 126,979 | 1,052,567 | 308,745,538 |
| POPULATION, HISPANIC OR LATINO ORIGIN | ||||
| Not Hispanic or Latino Map | 22,136 | 123,953 | 921,912 | 258,267,944 |
| Hispanic or Latino Map | 651 | 3,026 | 130,655 | 50,477,594 |
| POPULATION, RACE | ||||
| White alone Map | 21,171 | 119,136 | 856,869 | 223,553,265 |
| Black or African American alone Map | 222 | 1,482 | 60,189 | 38,929,319 |
| American Indian and Alaska Native alone Map | 158 | 1,103 | 6,058 | 2,932,248 |
| Asian alone Map | 567 | 2,069 | 30,457 | 14,674,252 |
| Native Hawaiian and Other Pacific Islander alone Map | 3 | 29 | 554 | 540,013 |
| Some Other Race alone Map | 204 | 846 | 63,653 | 19,107,368 |
| Two or More Races Map | 462 | 2,314 | 34,787 | 9,009,073 |
| POPULATION, SEX | ||||
| Male Map | 10,913 | 61,689 | 508,400 | 151,781,326 |
| Female Map | 11,874 | 65,290 | 544,167 | 156,964,212 |
| POPULATION, AGE (18 YEARS) | ||||
| 18 years and over Map | 18,000 | 101,488 | 828,611 | 234,564,071 |
| Under 18 years | 4,787 | 25,491 | 223,956 | 74,181,467 |
| POPULATION, AGE | ||||
| Under 5 years | 1,216 | 5,658 | 57,448 | 20,201,362 |
| 5 to 9 years | 1,283 | 6,835 | 60,440 | 20,348,657 |
| 10 to 14 years | 1,392 | 7,833 | 63,824 | 20,677,194 |
| 15 to 17 years | 896 | 5,165 | 42,244 | 12,954,254 |
| 18 and 19 years | 419 | 6,133 | 37,802 | 9,086,089 |
| 20 years | 209 | 3,029 | 19,537 | 4,519,129 |
| 21 years | 192 | 2,713 | 18,508 | 4,354,294 |
| 22 to 24 years | 687 | 4,824 | 44,122 | 12,712,576 |
| 25 to 29 years | 1,312 | 5,643 | 65,799 | 21,101,849 |
| 30 to 34 years | 1,117 | 5,376 | 61,163 | 19,962,099 |
| 35 to 39 years | 1,305 | 6,416 | 63,730 | 20,179,642 |
| 40 to 44 years | 1,576 | 8,594 | 73,130 | 20,890,964 |
| 45 to 49 years | 1,905 | 10,606 | 81,300 | 22,708,591 |
| 50 to 54 years | 1,872 | 10,663 | 81,050 | 22,298,125 |
| 55 to 59 years | 1,646 | 9,900 | 70,634 | 19,664,805 |
| 60 and 61 years | 633 | 3,560 | 25,250 | 7,113,727 |
| 62 to 64 years | 886 | 5,014 | 34,705 | 9,704,197 |
| 65 and 66 years | 486 | 2,710 | 18,483 | 5,319,902 |
| 67 to 69 years | 681 | 3,432 | 24,319 | 7,115,361 |
| 70 to 74 years | 868 | 4,013 | 31,077 | 9,278,166 |
| 75 to 79 years | 750 | 3,259 | 26,645 | 7,317,795 |
| 80 to 84 years | 651 | 2,745 | 24,607 | 5,743,327 |
| 85 years and over | 805 | 2,858 | 26,750 | 5,493,433 |
| MEDIAN AGE BY SEX | ||||
| Both sexes Map | 44.30 | 42.30 | 39.40 | 37.20 |
| Male Map | 42.70 | 41.20 | 37.80 | 35.80 |
| Female Map | 45.70 | 43.30 | 40.80 | 38.50 |
| HOUSEHOLDS | ||||
| Total Households Map | 9,666 | 49,177 | 413,600 | 116,716,292 |
| HOUSEHOLDS, HOUSEHOLD TYPE | ||||
| Family households: Map | 6,077 | 32,297 | 259,561 | 77,538,296 |
| Husband-wife family Map | 4,503 | 25,672 | 183,904 | 56,510,377 |
| Other family: Map | 1,574 | 6,625 | 75,657 | 21,027,919 |
| Male householder, no wife present Map | 436 | 1,960 | 19,694 | 5,777,570 |
| Female householder, no husband present Map | 1,138 | 4,665 | 55,963 | 15,250,349 |
| Nonfamily households: Map | 3,589 | 16,880 | 154,039 | 39,177,996 |
| Householder living alone Map | 2,974 | 12,825 | 122,488 | 31,204,909 |
| Householder not living alone Map | 615 | 4,055 | 31,551 | 7,973,087 |
| HOUSEHOLDS, HISPANIC OR LATINO ORIGIN OF HOUSEHOLDER | ||||
| Not Hispanic or Latino householder: Map | 9,487 | 48,492 | 376,946 | 103,254,926 |
| Hispanic or Latino householder: Map | 179 | 685 | 36,654 | 13,461,366 |
| HOUSEHOLDS, RACE OF HOUSEHOLDER | ||||
| Householder who is White alone | 9,222 | 47,161 | 354,090 | 89,754,352 |
| Householder who is Black or African American alone | 80 | 364 | 20,488 | 14,129,983 |
| Householder who is American Indian and Alaska Native alone | 54 | 374 | 2,060 | 939,707 |
| Householder who is Asian alone | 164 | 586 | 8,987 | 4,632,164 |
| Householder who is Native Hawaiian and Other Pacific Islander alone | 1 | 9 | 164 | 143,932 |
| Householder who is Some Other Race alone | 59 | 191 | 18,784 | 4,916,427 |
| Householder who is Two or More Races | 86 | 492 | 9,027 | 2,199,727 |
| HOUSEHOLDS, HOUSEHOLD TYPE BY HOUSEHOLD SIZE | ||||
| Family households: Map | 6,077 | 32,297 | 259,561 | 77,538,296 |
| 2-person household Map | 2,858 | 14,827 | 108,020 | 31,882,616 |
| 3-person household Map | 1,444 | 7,364 | 63,618 | 17,765,829 |
| 4-person household Map | 1,092 | 6,399 | 52,498 | 15,214,075 |
| 5-person household Map | 474 | 2,616 | 22,776 | 7,411,997 |
| 6-person household Map | 146 | 760 | 8,043 | 3,026,278 |
| 7-or-more-person household Map | 63 | 331 | 4,606 | 2,237,501 |
| Nonfamily households: Map | 3,589 | 16,880 | 154,039 | 39,177,996 |
| 1-person household Map | 2,974 | 12,825 | 122,488 | 31,204,909 |
| 2-person household Map | 525 | 2,892 | 25,493 | 6,360,012 |
| 3-person household Map | 65 | 617 | 3,721 | 992,156 |
| 4-person household Map | 18 | 333 | 1,512 | 411,171 |
| 5-person household Map | 4 | 154 | 538 | 126,634 |
| 6-person household Map | 3 | 44 | 189 | 48,421 |
| 7-or-more-person household Map | 0 | 15 | 98 | 34,693 |
| HOUSING UNITS | ||||
| Total Housing Units Map | 12,320 | 62,206 | 463,388 | 131,704,730 |
| HOUSING UNITS, OCCUPANCY STATUS | ||||
| Occupied Map | 9,666 | 49,177 | 413,600 | 116,716,292 |
| Vacant Map | 2,654 | 13,029 | 49,788 | 14,988,438 |
| HOUSING UNITS, OCCUPIED, TENURE | ||||
| Owned with a mortgage or a loan Map | 4,415 | 26,432 | 185,168 | 52,979,430 |
| Owned free and clear Map | 1,907 | 9,571 | 65,784 | 23,006,644 |
| Renter occupied Map | 3,344 | 13,174 | 162,648 | 40,730,218 |
| HOUSING UNITS, VACANT, VACANCY STATUS | ||||
| For rent Map | 318 | 989 | 15,763 | 4,137,567 |
| Rented, not occupied Map | 17 | 82 | 727 | 206,825 |
| For sale only Map | 154 | 823 | 5,171 | 1,896,796 |
| Sold, not occupied Map | 37 | 175 | 1,219 | 421,032 |
| For seasonal, recreational, or occasional use Map | 1,890 | 9,984 | 17,077 | 4,649,298 |
| For migrant workers Map | 0 | 1 | 12 | 24,161 |
| Other vacant Map | 238 | 975 | 9,819 | 3,652,759 |
| HOUSING UNITS, OCCUPIED, AVERAGE HOUSEHOLD SIZE BY TENURE | ||||
| Total: Map | 2.33 | 2.45 | 2.44 | 2.58 |
| Owner occupied Map | 2.46 | 2.56 | 2.59 | 2.65 |
| Renter occupied Map | 2.08 | 2.15 | 2.21 | 2.44 |
| HOUSING UNITS, OCCUPIED, TENURE BY RACE OF HOUSEHOLDER | ||||
| Owner occupied: Map | 6,322 | 36,003 | 250,952 | 75,986,074 |
| Householder who is White alone Map | 6,098 | 34,970 | 231,315 | 63,446,275 |
| Householder who is Black or African American alone Map | 27 | 156 | 6,559 | 6,261,464 |
| Householder who is American Indian and Alaska Native alone Map | 13 | 157 | 596 | 509,588 |
| Householder who is Asian alone Map | 125 | 382 | 4,230 | 2,688,861 |
| Householder who is Native Hawaiian and Other Pacific Islander alone Map | 0 | 5 | 49 | 61,911 |
| Householder who is Some Other Race alone Map | 18 | 80 | 5,014 | 1,975,817 |
| Householder who is Two or More Races Map | 41 | 253 | 3,189 | 1,042,158 |
| Renter occupied: Map | 3,344 | 13,174 | 162,648 | 40,730,218 |
| Householder who is White alone Map | 3,124 | 12,191 | 122,775 | 26,308,077 |
| Householder who is Black or African American alone Map | 53 | 208 | 13,929 | 7,868,519 |
| Householder who is American Indian and Alaska Native alone Map | 41 | 217 | 1,464 | 430,119 |
| Householder who is Asian alone Map | 39 | 204 | 4,757 | 1,943,303 |
| Householder who is Native Hawaiian and Other Pacific Islander alone Map | 1 | 4 | 115 | 82,021 |
| Householder who is Some Other Race alone Map | 41 | 111 | 13,770 | 2,940,610 |
| Householder who is Two or More Races Map | 45 | 239 | 5,838 | 1,157,569 |
| HOUSING UNITS, OCCUPIED, TENURE BY HISPANIC OR LATINO ORIGIN OF HOUSEHOLDER | ||||
| Owner occupied: Map | 6,322 | 36,003 | 250,952 | 75,986,074 |
| Not Hispanic or Latino householder Map | 6,259 | 35,668 | 240,966 | 69,617,625 |
| Hispanic or Latino householder Map | 63 | 335 | 9,986 | 6,368,449 |
| Renter occupied: Map | 3,344 | 13,174 | 162,648 | 40,730,218 |
| Not Hispanic or Latino householder Map | 3,228 | 12,824 | 135,980 | 33,637,301 |
| Hispanic or Latino householder Map | 116 | 350 | 26,668 | 7,092,917 |
| HOUSING UNITS, OCCUPIED, TENURE BY HOUSEHOLD SIZE | ||||
| Owner occupied: Map | 6,322 | 36,003 | 250,952 | 75,986,074 |
| 1-person household Map | 1,502 | 7,366 | 54,568 | 16,453,569 |
| 2-person household Map | 2,474 | 14,056 | 90,849 | 27,618,605 |
| 3-person household Map | 1,032 | 6,053 | 43,883 | 12,517,563 |
| 4-person household Map | 817 | 5,461 | 38,232 | 10,998,793 |
| 5-person household Map | 351 | 2,185 | 15,462 | 5,057,765 |
| 6-person household Map | 100 | 616 | 5,179 | 1,965,796 |
| 7-or-more-person household Map | 46 | 266 | 2,779 | 1,373,983 |
| Renter occupied: Map | 3,344 | 13,174 | 162,648 | 40,730,218 |
| 1-person household Map | 1,472 | 5,459 | 67,920 | 14,751,340 |
| 2-person household Map | 909 | 3,663 | 42,664 | 10,624,023 |
| 3-person household Map | 477 | 1,928 | 23,456 | 6,240,422 |
| 4-person household Map | 293 | 1,271 | 15,778 | 4,626,453 |
| 5-person household Map | 127 | 585 | 7,852 | 2,480,866 |
| 6-person household Map | 49 | 188 | 3,053 | 1,108,903 |
| 7-or-more-person household Map | 17 | 80 | 1,925 | 898,211 |
Loading...